

I’ve known intuitively that customers take longer on average to decide to buy high price point items than they do to make impulse buys. Hence the name, “impulse buy.”
But, how much longer? And is that just my gut gurgling, or is there really data to back my assumption?
Those were the questions that led us deep into the Time Lag reports across a wide cross-section of StubGroup’s ecommerce clients.
Actually, the one question that sparked this data collection was from a client who was launching a product in the $40 price range and wanted to know how long it would take customers to decide to purchase the product after reaching the business’s website.
We figure lots of businesses are asking how long that conversion journey takes, so we put together the following scatter plots comparing average order value against the percentage of customers who placed orders during four time frames:
- Same day as first visit to website
- 1-5 days after visiting website
- 6-11 days after visiting website
- 12-30 days after visiting website
Check the notes at the end of this post for details about how we generated the data.
Percentage of Orders Placed Same Day as First Visiting Website vs. Average Order Value
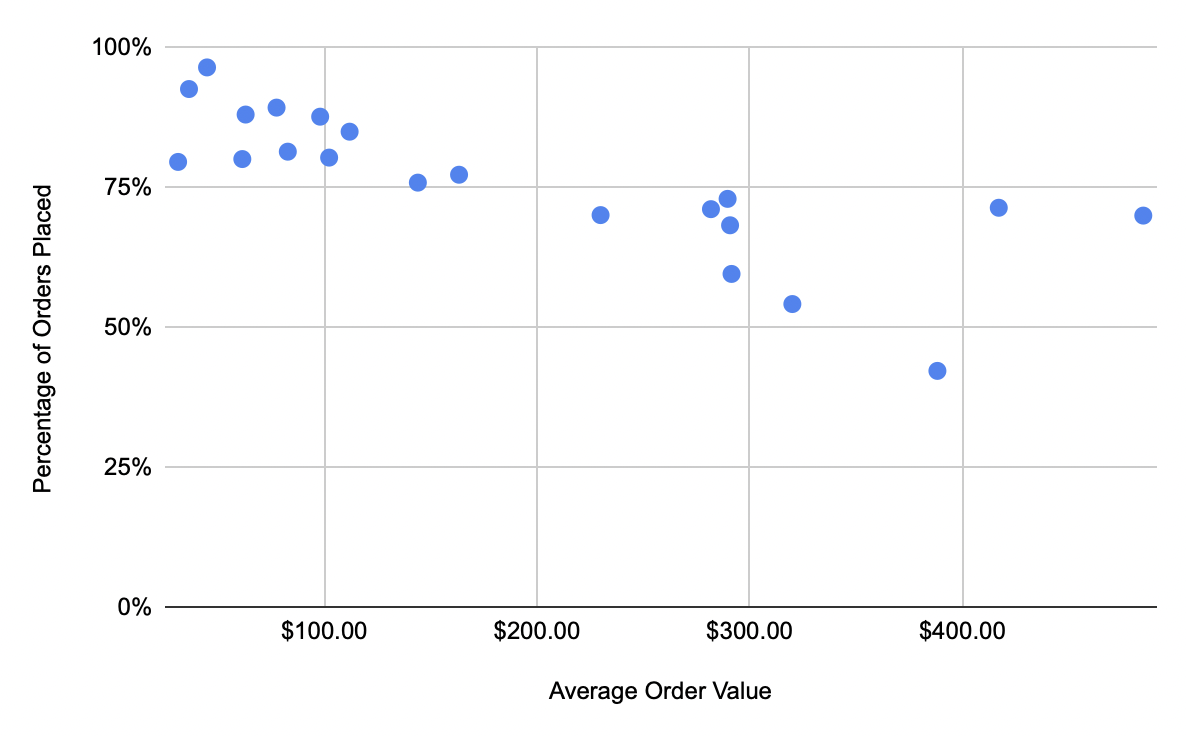
All of the ecommerce retailers with average order values under $200 saw 75% of their orders come the same day that the customer reached the website, with some retailers near the low average order value range seeing almost 100% same-day sales.
Percentage of Orders Placed 1-5 Days After First Visiting Website vs. Average Order Value
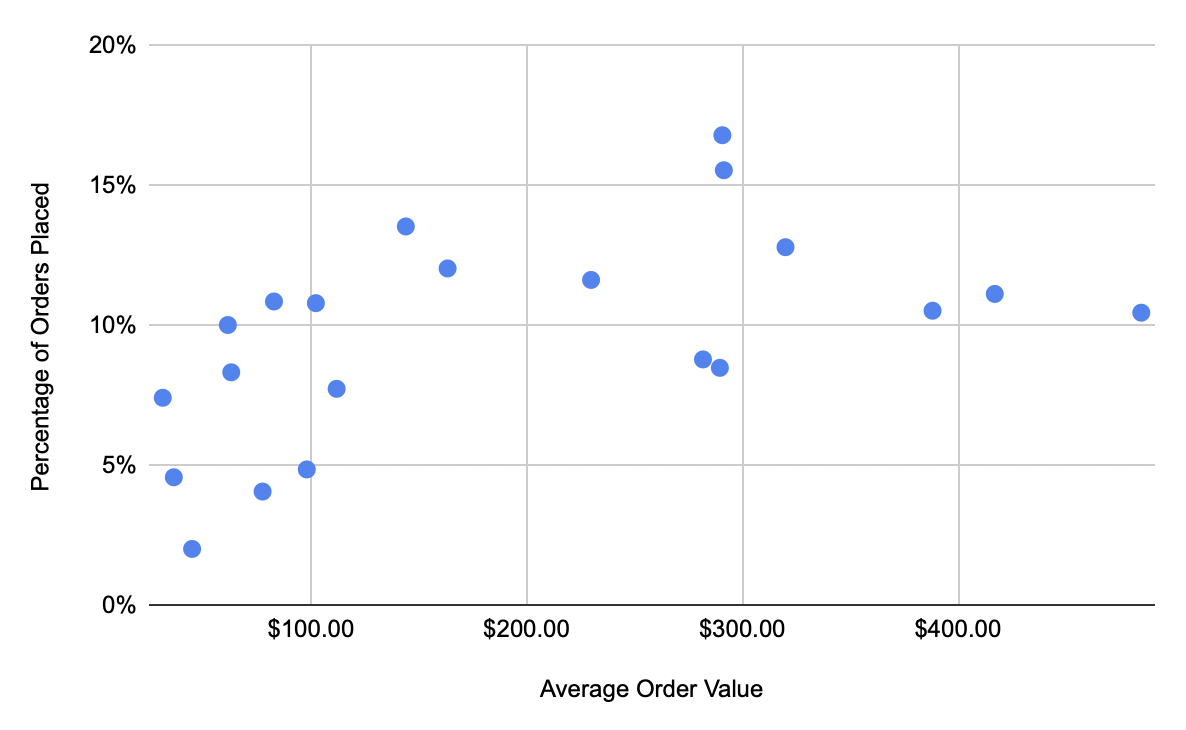
None of the retailers sampled saw more than 20% of their orders come during days 1-5 after a customer first reached the website.
We see again a trend of higher average order values equating to a longer sales cycle.
Percentage of Orders Placed 6-11 Days After First Visiting Website vs. Average Order Value
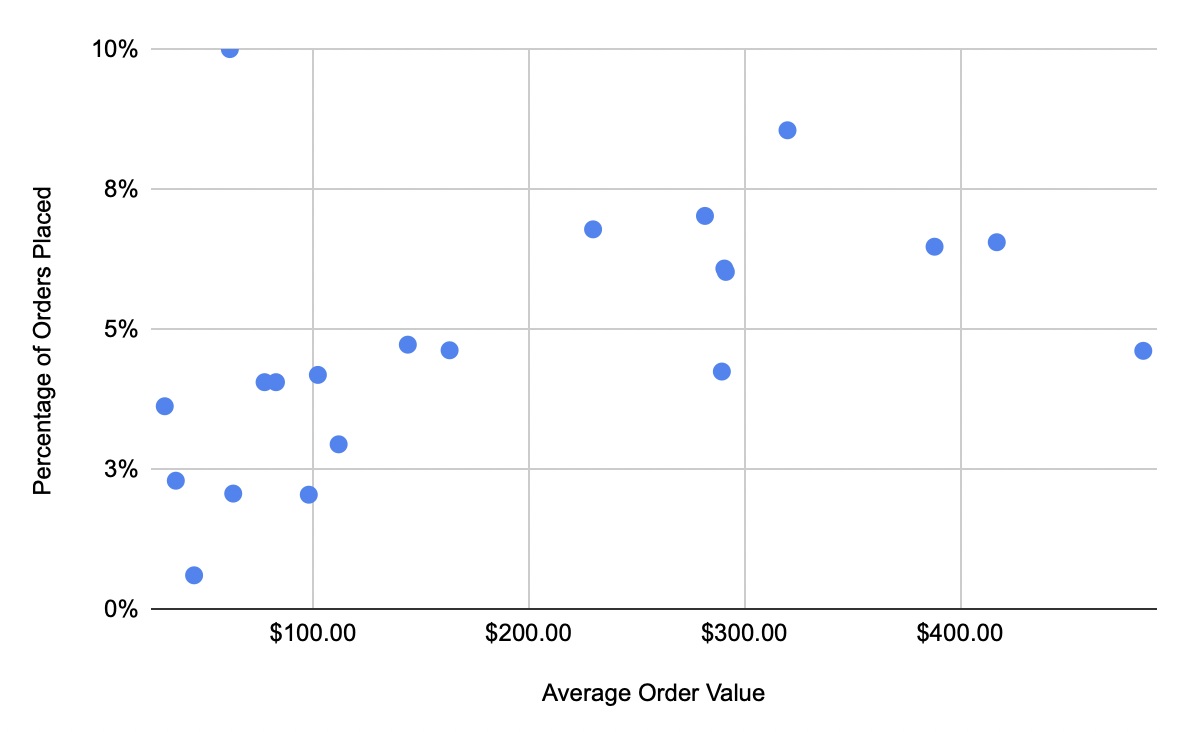
The trend line largely continues, except for a single outlier with an average order value under $100 seeing 10% of orders in days 6-11 after the customer first visited their website.
Percentage of Orders Placed 12-30 Days After First Visiting Website vs. Average Order Value
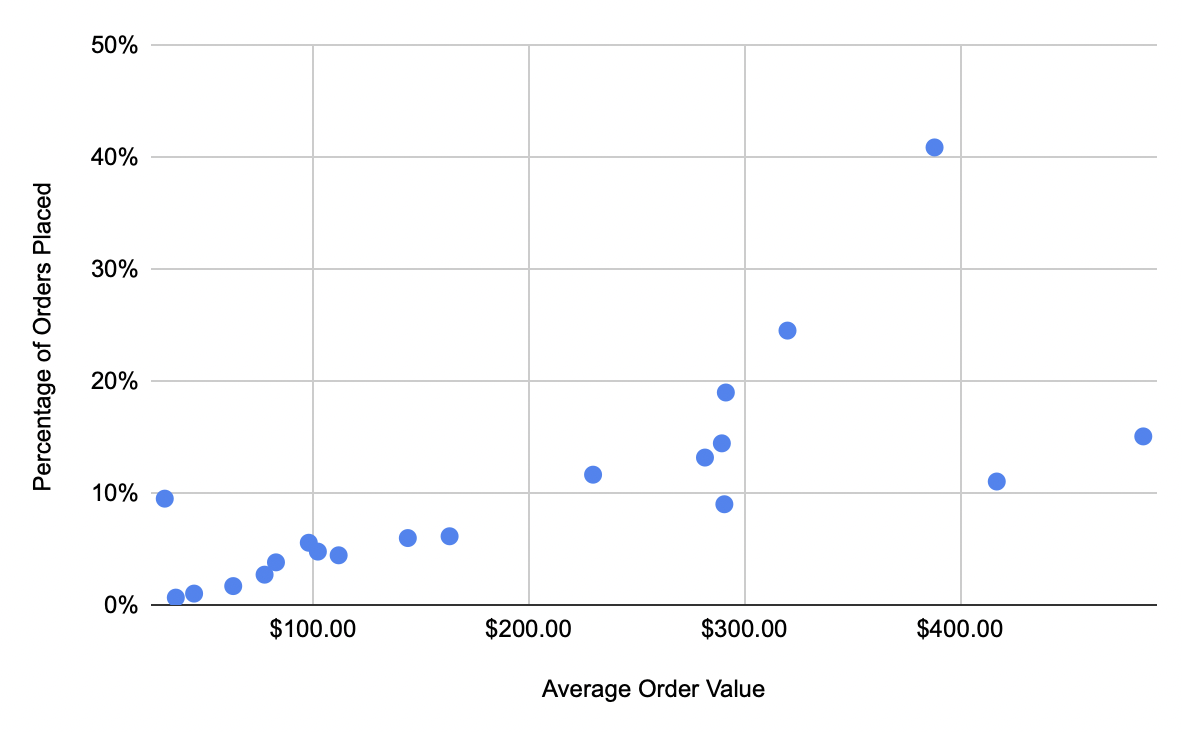
During the tail end of 12-30 days after a customer first reaches the website, we see very few orders coming in for clients with average order values under $100, but a healthy percentage of orders still trickle back from clients with higher average order values.
What to Do with This Data
- If you’re just starting an ecommerce store and don’t have your own benchmark data to use, you can use this data to peg your expected time lag until you are able to collect data of your own.
- If you’re an agency or freelancer working with a client, take this as a reminder that time lag is a crucial component to your reporting, analyses, and discussions with your client.
- For anyone looking to improve ecommerce performance, remember that the higher your price point, the longer your sales cycle will likely be, and you have to factor that in when you’re evaluating how successful a sale, channel, ad copy test, etc. has been.
Notes About the Data
We sourced the time lag data from Google Analytics. That creates opportunity for flaws in the data, because Google Analytics doesn’t always accurately track a customer’s first visit to the website (e.g. if they visit from a mobile device first, then come back via a computer and place an order on the computer). That said, looking at a substantial amount of data across many retailers helps to smooth any skewing created by those flaws.
We looked at orders from all traffic sources, including Paid, Organic, etc. Our clients inherently rely on Paid traffic as an important part of their customer acquisition strategy, so it’s possible these numbers could look a little different for retailers who don’t use paid advertising.
We looked at average order value as a signal of price point. Most retailers carry products at a variety of price points, and are trying to cross-sell and up-sell in order to increase average order value, so we considered average order value to be the most accurate and realistic datapoint that we could track related to price point vs. time lag.
We looked at average order values from our clients between $30 and $500, and removed some outliers from the charts which had average order values of $2k+. However, those $2k+ values still tracked consistently with the rest of the data, with same-day orders at only 50%-60% of their total orders.

John Horn is the CEO of StubGroup. A self-proclaimed PPC Nerd, he has taught digital advertising classes to more than 90,000 students and makes frequent appearances on podcasts in the marketing and business space. He invests his time and energy into equipping the StubGroup team to provide best-in-class service.